
How Do You Calculate GPS Fleet Tracking ROI?
GPS Fleet tracking ROI is the amount of return you receive on the investment you make in a tracking system. It is measured by comparing the cost with your savings. When it comes to ROI, saving more than you spend will be positive. It is shown as a percentage, so you can compare it to other...
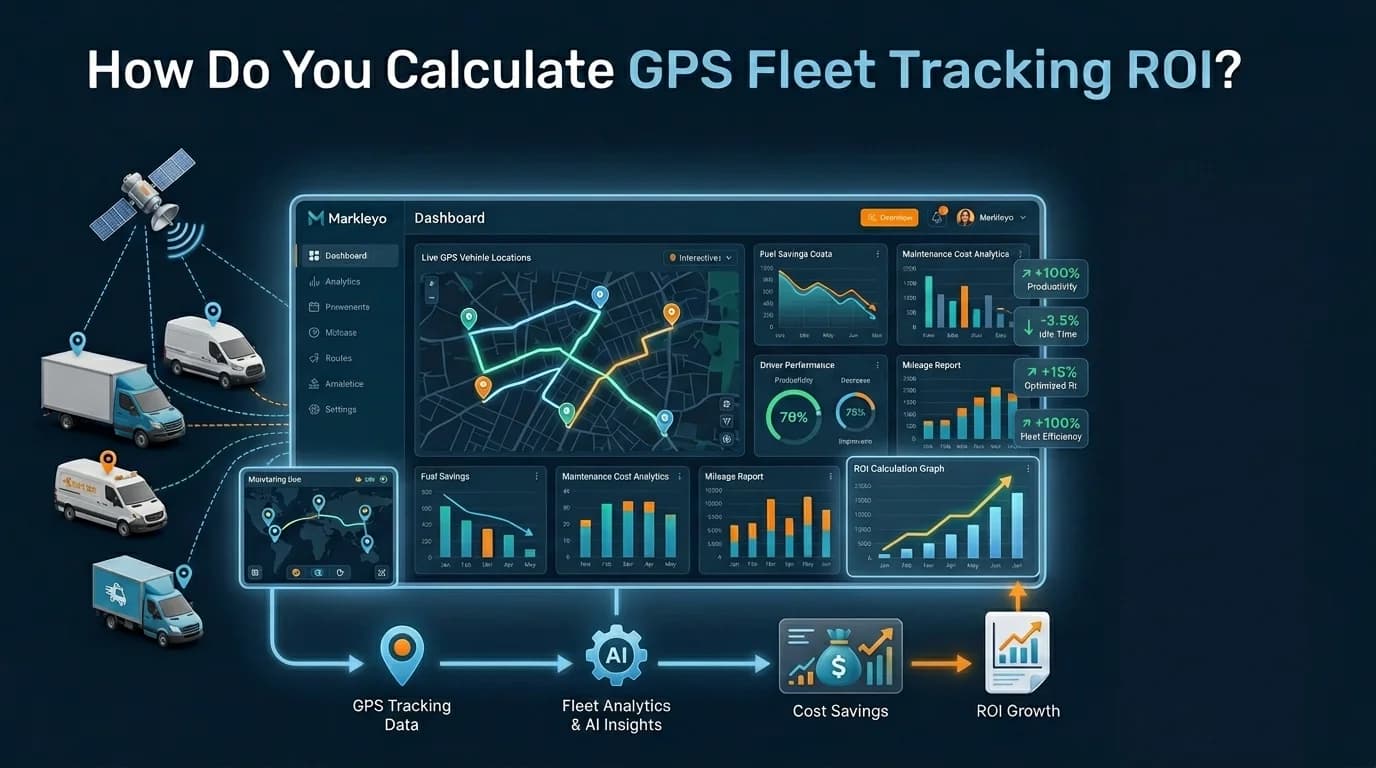
GPS Fleet tracking ROI is the amount of return you receive on the investment you make in a tracking system. It is measured by comparing the cost with your savings. When it comes to ROI, saving more than you spend will be positive. It is shown as a percentage, so you can compare it to other investments.
ROI is a way to quantify gut feeling. You don't need to say
it helps; you can just say it returns 200 percent. That's the type of evidence a business owner relies on. The easiest way of determining whether a GPS fleet tracking system for fleet management. is worth your investment is to assign a dollar value to your gps tracking savings.
Why Measuring ROI Matters
This is a process that most fleets do not go through. They add tracking, experience fewer issues, and they believe it works. This is not a proof, however: “assume.” In times of budget constriction, untested tools are eliminated. When you can't demonstrate the return, you could end up losing the system that's saving you money.
Measuring ROI is also a way to get better. If you keep track of savings by the category, you will know what is working. Perhaps fuel economy may be good but idling may also be high. That's the direction you want to go in.
How to Calculate GPS Fleet Tracking ROI
It's easy to use and just follows a formula. ROI = Net savings / Cost x 100 Net savings: Total savings minus system cost. Here are the words for the formula.
ROI percent = (total savings - total cost) / total cost x 100.
It requires two numbers to be used. The total cost is the first thing that comes to mind. This includes software, hardware and setup during the period you are measuring. Second is the amount of money you've saved. This is the sum of money that you saved in the same period for fuel, labour, maintenance and other costs.
It's the saving that's hard. There is no measurement for savings without a base line. A baseline is the initial start point of the cost of things before tracking. Before getting started, make notes of your fuel costs, overtime and repair expenses for a month or two. Once you have tracked, compare the numbers to the baseline. It's just your saving that makes the difference. If you have no base line, then you're just guessing. Having one, you have proof.
FleetScanner Insight: Idling is often not accurately tracked before introducing a GPS system, and fleets often underestimate fuel waste. Having a baseline prior to deployment gives the most accurate ROI calculation.
What Costs and Savings to Include
Good ROI calculation includes all things. Without the cost, the ROI begins to sound a bit too good to be true. If you miss a saving, it appears to be too weak. Make both sides of these.
Costs to include:
- Software costs (over period):
- Hardware over lifespan of use
- Setup and activation fees
- Staff time to manage the system
Savings to include:
- Fuel, from less idling, speeding, and fewer miles
- Labor, from less overtime and higher productivity
- Maintenance, from fewer breakdowns
- Insurance, from any fleet telematics discount
- Theft, from faster recovery and prevention
Many of these link to other tools. Fuel savings grow when you pair GPS tracking software with fuel monitoring and fuel theft detection. Maintenance savings grow with maintenance and service reminders. A full count gives you an honest ROI.
ROI Worked Example: A 30-Vehicle Fleet
Numbers make this real. Have a delivery fleet of 30 vans. Here is all the ROI math for one year!
| Item | Amount |
| Software ($25 x 30 x 12 months) | $9,000 |
| Hardware ($120 x 30, one-time) | $3,600 |
| Setup ($20 x 30, one-time) | $600 |
| Total Year 1 cost | $13,200 |
| Fuel savings (12% of $144,000) | $17,280 |
| Overtime savings | $6,000 |
| Maintenance savings | $4,000 |
| Total Year 1 savings | $27,280 |
| Net savings | $14,080 |
The ROI about 107 percent in year one would be calculated as follows: net savings (14,080) / cost (13,200) x 100. The ROI increases further the second year, with no new hardware and setup, and the savings remain.
ROI by Fleet Type: What Drives the Return
ROI differs based on the industry as each fleet is wasting money differently. Each fleet type has the potential to deliver the greatest savings in a given location, as listed below, and a typical range of first-year savings. These are just examples of ranges and should not be taken as a hard and fast number.
| Fleet Type | Main Saving Driver | Typical Year 1 ROI Range |
| Construction | Less idling, asset security | High |
| Logistics | Fuel and route efficiency | High |
| Service (HVAC, plumbing) | Productivity, less overtime | Medium to high |
| Refrigerated | Fuel plus cargo protection | Medium to high |
| Mixed delivery | Fuel and labor | Medium to high |
GPS Tracking ROI vs Manual Fleet Management
The returns are most apparent where you will make a comparison between tracking and managing a fleet manually. Manual processes obscure loss. Tracking exposes it.
| Metric | Manual Management | GPS Tracking |
| Fuel waste | Higher, hard to spot | Lower, idling flagged |
| Overtime | Higher, unverified hours | Lower, real hours logged |
| Visibility | Limited, phone check-ins | Real-time on a map |
| Maintenance | Reactive, missed services | Planned, alert-driven |
| ROI tracking | Difficult, manual math | Automated in reports |
The manual management costs money! It simply passes its expenses to you in terms of fuel, overtime and downtime that you will never experience. When these indirect expenses are translated into numbers, you can do something about them.
Fleet Tracking ROI Calculator
You don't need to do the maths calculations in your head. A fleet tracking ROI calculator helps to convert your numbers into an answer in seconds. Fill in the number of trucks, fuel costs, hours of idle reduction, and tracking cost. It provides the annual savings, payback period and ROI. Below is an example of what a GPS tracking ROI calculator will generate.
| Input | Example |
| Vehicles | 30 |
| Monthly fuel spend | $12,000 |
| Idle / waste reduction | 15% |
| Tracking cost | $750 per month |
| Output | Result |
| Annual fuel savings | $21,600 |
| Annual tracking cost | $9,000 |
| Net annual saving | $12,600 |
| Payback period | About 5 months |
| First-year ROI | About 140% |
Math is simple. Annual fuel of $144,000 times 15 percent is $21,600 saved. The yearly tracking expenses are $9,000, which is subtracted, leaving $12,600. In year 1, that's a return of 140 percent. A telematics ROI calculator can do the same for any fleet size, so you can try out your own vehicle tracking ROI before you purchase.
How to Track ROI Over Time
ROI is not a single amount of money. The top fleets monitor it on a monthly basis. Create a spreadsheet with the row for the baseline costs at the top and fill the rest of the rows with the new fuel, labor and repair costs for each month. Running saving = actual – baseline. This is an advantage when you have a budget to come up with and can alert you to a potential cost increase in time. There are tools available, such as fleet analytics and driver behavior monitoring that can help to automate much of this.
Challenges in Measuring ROI
The power of ROI is great, but not always pristine. There are some savings that are difficult to identify. How would you value a delivery that was on time and retained a customer? That is a real, but difficult-to-measure value, and you should be prepared to make a guess at it. The baseline is also important: If you did not record costs prior to tracking them, then use old fuel bills or payroll records instead. Saving is all about action. The system locates the waste and then it's up to your team to repair it. Your fleet management ROI is more about how you do things than it is about the software.
Common Mistakes in ROI Calculations
- Skipping the baseline. Numbers are essential to before tracking to prove the change. Record costs for a month prior to beginning.
- Counting savings but not costs. Without hardware or staff time it appears to be a better ROI. Count both sides out of the same book.
- Measuring once and stopping. One ROI is lost very quickly. Monitor monthly to maintain the proof up to date.
Frequently Asked Questions About GPS Fleet Tracking ROI
What is fleet tracking ROI?
Fleet tracking ROI is the profit you reap from the investment you make in a tracking system. You make a comparison between the savings and the cost and express the result as a percent. Return on Investment (ROI) indicates that the system pays for itself.
How do I calculate GPS fleet tracking ROI?
The formula for calculating it is: net savings/total cost x 100. Net savings is the total savings minus the system cost. Calculate the savings in fuel, labour and maintenance, then divide by the cost that you paid. The result is your ROI percent.
What is the payback period for fleet tracking?
Typically, most fleets see a return on investment within 6 to 12 months. Payback occurs when you've saved the same amount as you paid. Fleets that use a lot of fuel and idle a lot tend to recoup their investment sooner, often within 6 months.
How much can GPS tracking save per vehicle?
The savings vary, but many fleets see 10–15 percent savings on fuel alone per vehicle. Include labor and maintenance savings, and it's easy to see that these savings can pay for the monthly tracking payment many times over per vehicle.
Why do I need a baseline to measure ROI?
A baseline is what your costs were before tracking. But if you don't have it, you can't prove it's being saved. Record fuel, overtime and repair costs for a month before starting.
Is fleet tracking ROI worth it for small fleets?
Yes, often. Saving is important to small fleets, and even small amounts have a major impact on costs. It is still a valid ROI math and tracking can save money by reducing idling and unauthorized driving for a handful of vehicles.
Conclusion
GPS fleet tracking ROI is a game-changer for forecasting and substantiating what feels like a gut feeling. It's actually quite easy to compute: net savings/cost x 100. The trick is to have a starting point so you can see what the actual difference is, and a monthly practice to ensure that the proof is up to date. Most fleets will realize a high ROI in the first year. If you can demonstrate that number, the system will be safe at budget time and you are operating a more economical fleet. Now you need to establish your initial savings goals and begin saving today.
Looking for a true number of vehicles in your fleet? Get a free Fleet ROI Assessment.. Let us know the size of your fleet and how much fuel you're using each month, and we'll calculate how much you can save and how long it will take.
Related Reading
Pillar guide
- GPS Fleet Tracking Systems for Fleet Management - the complete overview of fleet tracking technology.
In this series
- Fleet Tracking Software Pricing Guide: Costs, Features and ROI - what the system costs before you measure the return.
- How to Choose the Right Fleet Tracking Software - pick a system with the reporting to prove ROI.
Tools that drive ROI
- GPS Tracking Software and Fuel Management - the two biggest savings drivers.
- Driver Management and Fleet Analytics - track savings and prove returns.
Keep reading

Construction Equipment GPS Tracking: Theft and Utilization
Construction Equipment GPS Tracking helps prevent theft, reduce idle time, improve utilization, and schedule maintenance using real-time asset data.

School Bus GPS Tracking: Features, AIS-140 & Buying Guide
Learn how school bus GPS tracking works, AIS-140 requirements, safety features, parent alerts, and how to choose the right tracking system for schools.
GPS Tracking Hardware: How to Choose the Right Trackers
When selecting GPS tracking hardware, consider the type that is compatible with your tracking business and your customers' needs, determine if the trackers are compatible with the protocols of your platform (which helps prevent vendor lock-in), assess network capabilities for the areas you serve...