
20 Fleet Management KPIs Every Manager Should Track (With Formulas)
Most fleets track the wrong numbers. Here are 20 fleet management KPIs with simple formulas and targets, how to show them on a KPI dashboard, and the five numbers that prove your fleet software is working.
 Prerit Khera17 min read

Fleet management KPIs are the few numbers that show whether your fleet is making or losing money. Most fleets drown in data but track the wrong things. They check the fuel bill but not the cost per mile. They log faults but never measure downtime. That leads to guessing, not control.
This guide lists the 20 fleet management KPIs that really affect cost, with a simple formula and a typical target for each. It also shows how to put them on a KPI dashboard, and how to use them to prove your fleet software is working.
Quick answer: The key fleet management KPIs are cost per mile, vehicle utilization, fuel efficiency, idle time, maintenance compliance, vehicle downtime and driver safety score. Watch 3 to 4 of them daily and review the rest monthly. Start with cost per mile and utilization.
Key takeaways
- The two most important fleet KPIs are cost per mile and vehicle utilization.
- Watch only 3 to 4 KPIs daily. Review the rest monthly, so the data does not bury you.
- Fuel and idle time KPIs target your biggest cost you can control.
- Maintenance and downtime KPIs protect uptime and vehicle life.
- KPIs only help when you set targets, check them weekly and act on them.
What are fleet management KPIs?
Fleet management KPIs (key performance indicators) are the numbers that show how well your fleet runs. They measure cost, use, maintenance, fuel and safety. Good KPIs turn raw data into clear signals, so you can spot waste, cut costs and make better decisions.
A KPI is not the same as a metric. A fleet metric is any number you can measure, such as trips made on a Tuesday. A KPI is a number tied to a goal. Downtime is a KPI because it measures your goal of keeping vehicles on the road. The skill is picking the few that matter for your fleet and acting on them.
A useful test: ask what action a number leads to. If idling jumped 18 percent at one depot, you can coach drivers, change routes or check warm-up habits. If one vehicle's maintenance cost is double its class average, you can inspect, replace or retire it. Numbers like total logins or raw GPS pings feel busy but lead to no action. Those are dashboard noise.
How to choose which fleet KPIs to track
Start with your worst problem. If fuel hurts, lead with fuel and idle KPIs. If breakdowns hurt, focus on maintenance and downtime. If vehicles sit around, focus on utilization, availability and route efficiency. Match the KPIs to your goal, not to the longest list.
Then set them up in layers:
- North star KPIs (daily): 3 to 4 numbers, such as cost per mile, utilization, downtime and fuel efficiency.
- Drill-down KPIs (monthly): the rest. They explain why the north stars moved.
A core set of five to seven KPIs is enough to show patterns. A short list is easier to manage, easier to explain to your boss and much harder to ignore.
The 20 fleet management KPIs to track
Here are the 20 KPIs grouped by area. Each has a simple formula and the reason it matters.
Cost KPIs
1. Cost per mile
The most important fleet KPI. It shows what each mile costs you to run.
- Formula: total operating cost / total miles driven. Operating cost usually includes fuel, maintenance, repairs, tires and other running costs.
- Why it matters: it shows whether each trip makes or loses money. Track it weekly, by vehicle. If one class of vehicles climbs from $0.74 to $0.89 per mile over two quarters, you know where to look.
2. Total cost of ownership (TCO)
The full cost of a vehicle over its life, not just the purchase price.
- Formula: purchase + fuel + maintenance + downtime + insurance, minus resale value.
- Why it matters: it guides repair, replace and budget decisions.
3. Maintenance cost per vehicle
Repair and service spend for each vehicle. An average across the fleet can hide problem units. This KPI shines a light on them.
- Formula: total maintenance cost / number of vehicles. Also look at each vehicle on its own.
- Why it matters: it finds vehicles that cost too much to keep running. Split it by vehicle class, age, depot and repair vendor. That shows if one old truck eats the budget, or if one vendor or depot keeps running high repair bills.
Operational KPIs
4. Vehicle utilization rate
How much each vehicle is actually used compared with how much it could be used.
- Formula: (miles driven / mileage capacity) x 100. You can also use engine hours or days in service.
- Why it matters: low use means money tied up in a vehicle that sits. Very high use wears vehicles out faster. Aim for balance, often 60 to 80 percent.
5. Idle time percentage
The share of engine-on time spent standing still.
- Formula: (idle hours / total engine hours) x 100
- Why it matters: an idling engine burns fuel and adds wear but does no work. Ten or fifteen extra minutes a day per vehicle adds up fast across a fleet.
6. On-time delivery rate
How often jobs arrive when promised.
- Formula: (on-time deliveries / total deliveries) x 100
- Why it matters: late deliveries cost you customers and trust.
7. Route efficiency
Planned miles compared with the miles actually driven.
- Formula: (planned miles / actual miles) x 100
- Why it matters: extra miles burn fuel and time. Low scores can also reveal route plans that were never realistic.
8. Asset availability
The share of vehicles ready for use when you need them.
- Formula: (vehicles ready for use / total vehicles) x 100
- Why it matters: high availability means maintenance planning works and dispatch can trust the list of ready vehicles at 6:15 a.m.
Maintenance KPIs
9. Preventive maintenance (PM) compliance
The share of scheduled services done on time. If 100 oil changes were due this month and 78 happened on schedule, PM compliance is 78 percent.
- Formula: (completed PM tasks / scheduled PM tasks) x 100
- Why it matters: missed service leads to more breakdowns, shorter vehicle life and bigger repair bills. Aim for 95 percent or more.
10. Vehicle downtime
Time a vehicle is off the road. Split planned downtime (booked service) from unplanned downtime (something failed).
- Formula: hours or days out of service per period, as a share of available time
- Why it matters: downtime hits labor, customer service, utilization and cost at once. A common target is under 3 percent of available time.
11. Mean time to repair (MTTR)
The average time from finding a problem to the vehicle being back in service.
- Formula: total repair time / number of repairs
- Why it matters: faster repairs mean more uptime. If MTTR drops, work orders, parts and approvals are moving faster.
12. Breakdown frequency
How often vehicles fail without warning.
- Formula: unplanned breakdowns / number of vehicles, per month
- Why it matters: a falling breakdown rate shows that maintenance is catching problems early.
13. Repeat repair rate
How often the same fault comes back after a repair.
- Formula: (repairs on the same fault within a set period / total repairs) x 100
- Why it matters: a brake issue that returns two weeks after a fix points to poor diagnosis, the wrong part or rushed work. This rate falling is even better news than fewer breakdowns.
14. Work order completion time
How long a job takes from creation to close, including diagnosis, approvals, repair and sign-off.
- Formula: average time from work order created to work order closed
- Why it matters: a high number points to hidden bottlenecks, such as slow approvals or unclear parts status.
15. Parts inventory turnover
How fast your spare parts stock is used and replaced.
- Formula: cost of parts used in the period / average value of parts in stock
- Why it matters: too little stock delays repairs. Too much ties up cash and shelf space. Good spare parts inventory software flags low stock and slow-moving parts.
Fuel KPIs
16. Fuel efficiency (MPG)
Average miles per gallon, by vehicle and by driver.
- Formula: total miles / total gallons used
- Why it matters: it finds thirsty vehicles and drivers. Fuel is the biggest variable cost for most fleets.
17. Fuel spend per vehicle
Fuel cost for each vehicle.
- Formula: total fuel cost / number of vehicles
- Why it matters: outliers point to waste or possible theft. Fleet fuel management tools make these outliers easy to see.
Safety KPIs
18. Driver safety score
A score built from events such as speeding, harsh braking, rapid acceleration and long idling.
- Formula: weighted points per event, often per 100 or 1,000 miles
- Why it matters: it lowers accidents, fuel use and insurance costs. The score is not the goal. The trend is. If events drop after coaching, your system is changing behavior. See how to set RAG thresholds for driver scores to build fair red, amber and green bands.
19. Accident rate and incident cost
The common safety measure, plus what each incident costs you.
- Formula: (accidents / miles driven) x 1,000,000. Also track claims cost and repair cost per incident.
- Why it matters: insurers use it to set premiums. Lower is better. It is a slow KPI to move, but a strong proof point when it does.
20. Inspection compliance and defect resolution time
The share of required inspections done, and how long flagged defects take to fix.
- Formula: (completed inspections / required inspections) x 100, plus average days from defect found to defect closed
- Why it matters: it keeps you compliant with DOT rules and ready for audits. A defect that is written down but never fixed is still a risk.
Fleet KPI summary table
This table gives you the formula and typical target for each fleet KPI at a glance.
| KPI | Formula | Typical target |
|---|---|---|
| Cost per mile | Total cost / miles driven | Track weekly, trend down |
| Total cost of ownership | All lifetime costs minus resale | Lower per mile over time |
| Maintenance cost per vehicle | Maintenance cost / vehicles | Flag high-cost vehicles |
| Vehicle utilization | (Miles / capacity) x 100 | 60 to 80 percent |
| Idle time percentage | (Idle hours / engine hours) x 100 | As low as possible |
| On-time delivery | (On-time / total) x 100 | 95 percent or more |
| Route efficiency | (Planned / actual miles) x 100 | Close to 100 percent |
| Asset availability | (Ready vehicles / total) x 100 | Trend up |
| PM compliance | (Completed / scheduled) x 100 | 95 percent or more |
| Vehicle downtime | Hours out of service | Under 3 percent of time |
| Mean time to repair | Repair time / repairs | Trend down |
| Breakdown frequency | Breakdowns / vehicles, per month | Trend down |
| Repeat repair rate | (Repeat repairs / repairs) x 100 | Trend down |
| Work order completion time | Created to closed, average | Trend down |
| Parts inventory turnover | Parts used / average stock | No stock-outs, little dead stock |
| Fuel efficiency (MPG) | Miles / gallons | Trend up |
| Fuel spend per vehicle | Fuel cost / vehicles | Flag outliers |
| Driver safety score | Weighted event points | Green band |
| Accident rate | (Accidents / miles) x 1M | Lower is better |
| Inspection compliance | (Completed / required) x 100 | 100 percent |
How to build a fleet management KPI dashboard
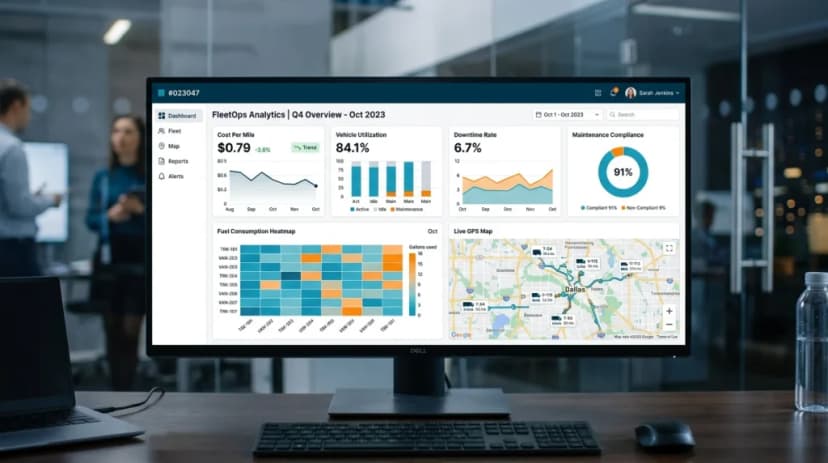
A fleet management KPI dashboard is one screen that shows your most important numbers, updated from your vehicles automatically. A good one answers "are we on track?" in a few seconds. A bad one shows 40 charts that nobody reads.
What to put on a fleet KPI dashboard
- Top row: your north stars. Three or four big numbers, such as cost per mile, utilization, downtime and MPG. Show this month, last month and an arrow for the trend.
- Second row: drill-downs. Idle time, PM compliance, MTTR and fuel spend per vehicle. These explain why the top row moved.
- Exceptions list. The vehicles and drivers outside their targets right now, sorted worst first.
- Trend charts. A 90-day line for each north star, so one bad week does not cause panic.
Split the dashboard by vehicle class, depot or region
One fleet-wide target can hide a lot of problems. A light service van should not be judged like a heavy truck with a different route and load. Filter KPIs by vehicle class, depot, route type or region, so your comparisons stay fair. Weak spots become easier to see and easier to fix.
Watch trends, not one-off spikes
One bad week can send anybody into panic mode. Resist that. If idle time spikes for a week of extreme weather, that is different from a steady three-month climb. Trends tell you a process changed. Spikes just tell you something odd happened.
Set alerts when a KPI leaves its target
A dashboard only helps when someone looks at it. Alerts fix that. Set a target band for each KPI and get an alert when a vehicle or depot moves outside it. That way you hear about a problem the week it starts, not at month-end.
Reporting dashboards vs AI analytics
A reporting dashboard shows you what happened. AI analytics goes a step further. It looks for the cause and can answer plain questions, such as "which vans had the highest cost per mile last month, and why?" When you compare platforms, ask whether they only draw charts or also explain the numbers. Fleet Scanner includes fleet reporting software with 60+ ready reports and dashboards, plus fleet analytics and a built-in fleet AI agent you can ask questions in plain words.
Fleet KPIs that prove your software is working
Fleet software can look impressive on a screen and still leave you wondering on Monday morning what actually got better. You want proof, not pretty charts. When software works, your operation feels calmer: fewer surprise breakdowns, fewer calls chasing vehicle status, and less guessing about which unit drains money.
Start with outcomes, not features
A feature list does not prove value. Alerts, maps, work orders, scorecards and inspection forms only matter if they lead to better results. Start with the outcomes you care about: lower fuel spend, fewer missed services, faster repairs, more vehicles available and cleaner inspections. Then ask which features should move those numbers.
That keeps you honest. If downtime stays flat and fuel waste keeps climbing, the software is not working in the way that counts.
The KPIs that usually move first
- Cost per mile. If it drops after better service planning or route changes, that is proof, not a feeling.
- Utilization. Software often reveals one van overloaded while another sits idle three rows over.
- Unplanned downtime. Planned downtime gets more organized and unplanned downtime shrinks.
- Fuel and idle time. Fuel is usually one of the first leaks you notice. If you want to act on it, see how to reduce fuel costs with fleet tracking software.
- PM compliance. If software is meant to keep you ahead of problems, this number should rise.
Record a clean baseline first
Without a before-and-after view, your results will feel fuzzy. Do not judge the software on the first messy week after launch. Compare the first full month after setup with a prior month or quarter, once data is coming in cleanly. No baseline, no proof. Just opinions.
Build a simple monthly scorecard
A one-page scorecard is usually enough for leadership. Group your numbers into four buckets: cost, maintenance, safety and utilization. Show this month, last month and the trend. It gives a much cleaner answer than a spreadsheet dumped into an inbox.
Use KPI gaps to decide what to fix next
A weak number should lead to a clear next step.
- PM compliance is low: tighten reminders and scheduling. Fleet maintenance software can book service by mileage, engine hours or date.
- Utilization is uneven: move vehicles between depots or jobs.
- Repeat repairs are rising: review diagnosis and repair history.
- Idle time stays high: coach drivers and look at route design. Driver scorecards and coaching tools help here.
Try this week: the five-number check
Pull five numbers for the last 90 days: cost per mile, downtime, PM compliance, utilization and idle time. Circle the one that bothers you most. Fix that one first. That is usually how software proves itself: one number getting better where you can feel it.
Common mistakes when tracking fleet KPIs
- Tracking too many KPIs. A huge dashboard causes fatigue and nobody acts. Pick 3 to 4 north stars and keep the rest as drill-downs.
- Collecting data but not acting. A KPI nobody reviews is a lost chance. Set a weekly time to check the numbers and give each KPI an owner.
- Using bad or manual data. Missed odometer entries, incomplete inspections, late work order closing and messy fuel data distort everything. Spreadsheets are slow and full of errors. Pull data automatically from vehicles where you can.
- Expecting instant gains without process changes. Software is not a magic wand. If alerts are ignored and work orders sit open for days, numbers stay flat. Pair visibility with small, steady process changes.
Example: three KPIs that told the story
This is a made-up scenario to show a typical pattern, not a real customer. A regional fleet of 30 vans tracked only its total fuel bill. The bill kept rising and nobody knew why. The manager started tracking three KPIs: cost per mile, idle time percentage and fuel efficiency.
The data told the story fast. Two vans had a very high cost per mile. Idle time across the fleet was around 20 percent. Three drivers had poor fuel efficiency from rough driving habits. The manager coached those drivers, set idle limits and retired one costly van. Within a few months, cost per mile and fuel spend came down. Nothing else changed. They measured the right things and acted on them. You can price the idle hours in your own fleet with this fuel cost calculator.
Frequently asked questions
What are the most important fleet management KPIs?
The key ones are cost per mile, vehicle utilization, fuel efficiency, idle time, maintenance compliance, vehicle downtime and driver safety score. Cost per mile and utilization are the two best signs of fleet health. Start with those and add more as you go.
How many KPIs should a fleet track?
Watch 3 to 4 north star KPIs daily, such as cost per mile, utilization, downtime and fuel efficiency. Keep a core set of five to seven and review the rest monthly as drill-downs. Tracking too many at once leads to dashboard fatigue and no action.
What should a fleet management KPI dashboard show?
Put your 3 to 4 north star KPIs at the top with this month, last month and a trend arrow. Below that, show drill-downs such as idle time, PM compliance and MTTR, plus a list of vehicles outside their targets. Add filters for vehicle class, depot and region.
What is a good cost per mile for a fleet?
It depends on the vehicle type, the load and where you operate, so there is no single right number. What matters is your own trend. Track cost per mile by vehicle and by class over time, and work to bring it down.
How do I calculate vehicle utilization rate?
Divide miles driven by mileage capacity, then multiply by 100. A van that drove 10,000 miles out of a possible 20,000 has 50 percent utilization. Aim for roughly 60 to 80 percent. Under 40 percent usually means money tied up in a vehicle that sits.
What is the difference between a KPI and a metric?
A metric is any number you can measure. A KPI is a number linked to a goal. Downtime is a KPI because it measures the goal of keeping vehicles on the road. Trips made on a Tuesday is just a metric.
Can fleet software track vendor performance metrics?
Yes, if it logs work orders and costs by vendor. Split maintenance cost per vehicle, repeat repair rate and repair time by the vendor that did the work. That shows which shops fix things right the first time and which keep sending the same vehicle back.
How does fleet tracking software help with KPIs?
GPS tracking software pulls KPI data from every vehicle automatically, so you do not depend on manual spreadsheets. It shows cost, fuel, idle and safety numbers in one place, updated as vehicles move. It can also alert you when a KPI moves outside its target.
Keep reading
FASTag Management Software for Fleets: How to Choose
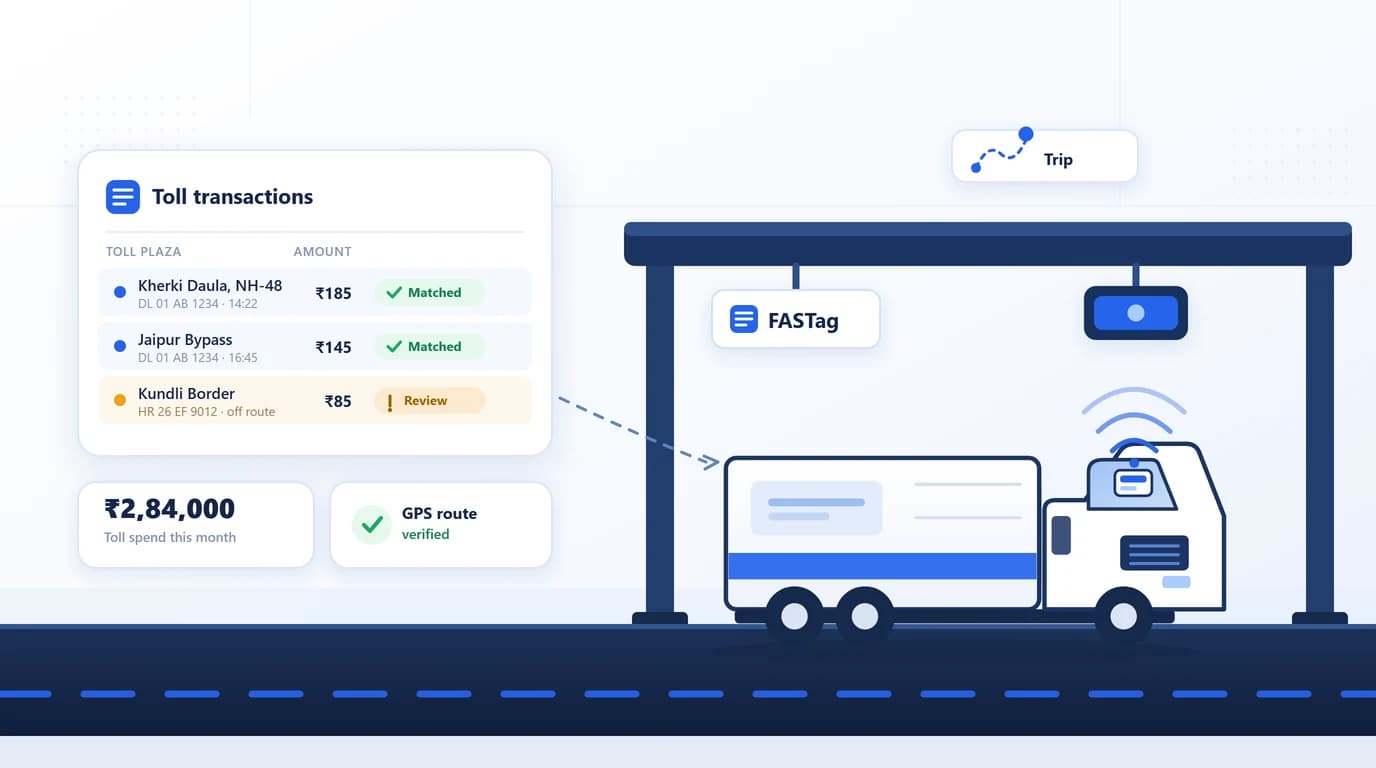
FASTag management software explained for fleets: how toll reconciliation works, the features to compare, what it costs and what to test in a vendor demo.

Preventive vs Reactive Fleet Maintenance: Which Costs Less?
Preventive maintenance services vehicles on a plan; reactive maintenance fixes them after they break. Here is what each really costs and how to switch to a planned schedule.

Fleet Workforce Management: Drivers, Shifts & Payroll
Learn how fleet workforce management connects driver scheduling, GPS attendance, shift planning, payroll, trip-based payments, and expense tracking.