
Fleet Analytics Software That Turns Fleet Data Into Profit
Fleet Scanner™ fleet analytics software shows what every truck, driver, route and customer really earns and costs you. Cost per km, fuel efficiency in km/l, idle hours, utilisation and the profit or loss of each trip are calculated for you from live GPS, trip, fuel and expense data, so you stop guessing at month end.
Whether you run ten trucks on a single lane or a few hundred across states, the numbers sit on one dashboard in ₹ and km, ready to compare, schedule and share. Built-in AI watches the data for unusual fuel use, delays and cost spikes and tells you before they eat into your margin.
Get Free Demo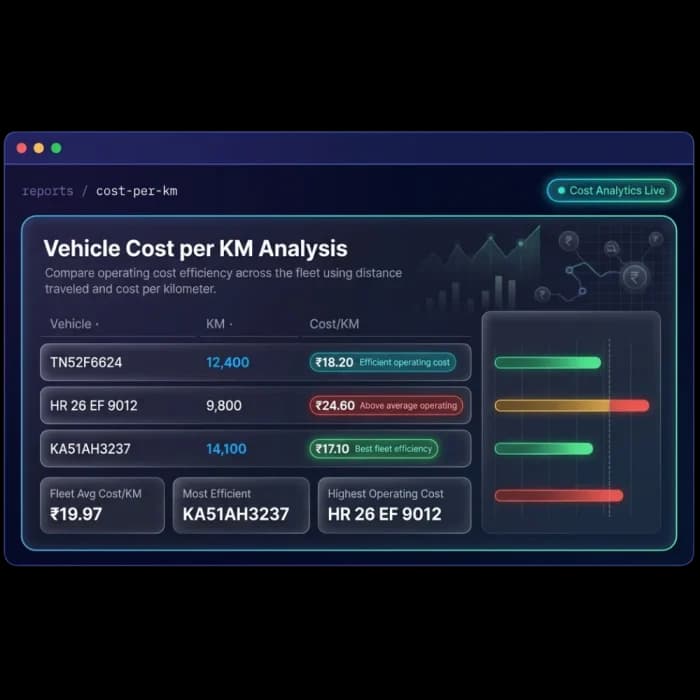
Where Fleet Margins Quietly Disappear
Your trucks produce data all day. Without analytics, it never becomes a decision.
Cost per Km Is a Guess
Most transporters know the monthly diesel bill and the freight received, but not what each truck really costs to run per kilometre once tyres, tolls, repairs and driver pay are added in.
Good and Bad Trips Look the Same
A trip booked at a healthy rate can still lose money after FASTag tolls, a long wait at the unloading point and an empty return leg. Without trip-level numbers, nobody notices.
Fuel and Idle Waste Stays Hidden
Diesel lost to idling with the engine on, harsh driving or pilferage rarely shows up until month end, when the money has already gone.
Reports Arrive Too Late to Act On
When figures are pulled by hand from the GPS portal, fuel slips and Excel sheets, the month has closed before anyone sees the problem.
One Analytics Layer Over Every Truck, Trip and Rupee
Fleet Scanner™ connects tracking, trips, fuel, maintenance and billing, so every number is calculated from what actually happened on the road.
Know what each truck costs to run, and how hard it works
Every vehicle gets its own cost per km, built from diesel, tolls, driver pay, trip expenses, repairs and tyres spread over the GPS kilometres it actually ran. Line trucks up against the fleet average and the expensive ones stand out at once.
Utilisation shows how much of the day each truck spends moving, standing idle with the engine on, or parked without work. Maintenance cost trends track repair and tyre spend month by month, so you can tell when an ageing vehicle is costing more than it earns.
- Cost per km for every vehicle, route and customer
- Running, idle and parked hours for every truck
- Loaded versus empty kilometres to spot empty return legs
- Repair and tyre cost history per vehicle over time
See the real km/l of every truck and every driver
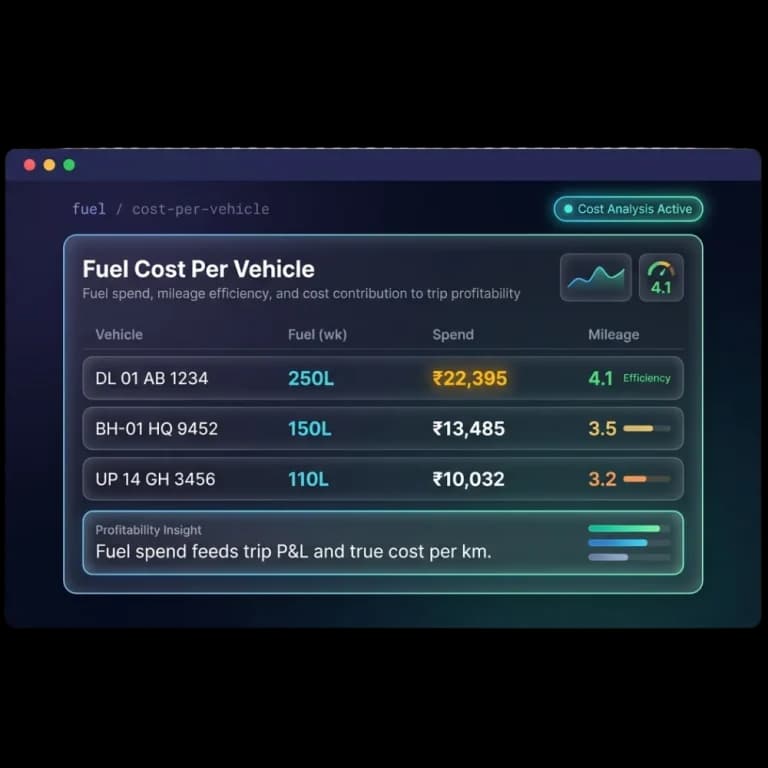
Diesel is usually the biggest line in a transporter’s costs. Fleet Scanner™ matches each fill and fuel card swipe with GPS distance to give true km/l by vehicle, by driver and by route, and shows how much of the spend went into each trip.
Compare the same model of truck on the same lane and the gaps become obvious. Fuel records and theft alerts come from fleet fuel management, so the analytics always use the same verified numbers.
- km/l per vehicle, driver and route for any period
- Fuel spend added to each trip’s profit and loss
- Idle burn shown next to fuel efficiency
- Under-performing trucks ranked for a quick check
Rank drivers on how they actually drive
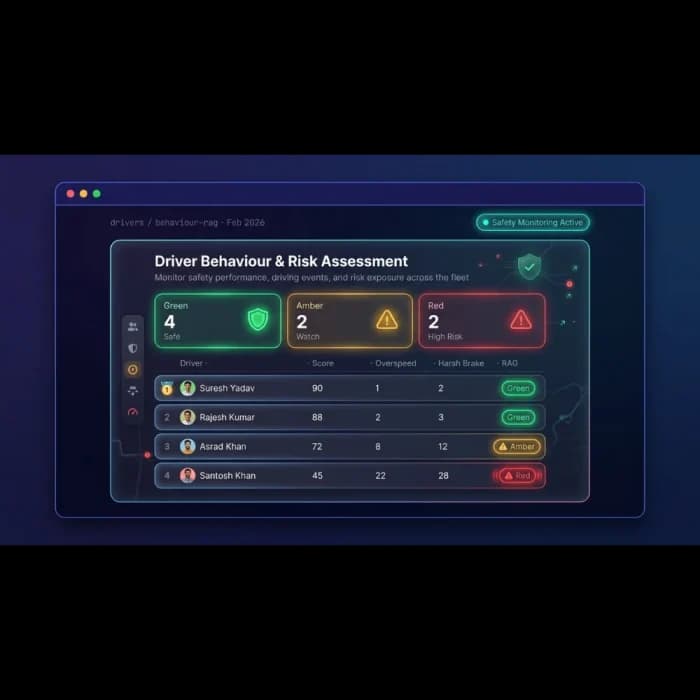
Overspeeding, harsh braking, idling and trip completion come together in one score for each driver, rated green, amber or red. You see who needs coaching, who deserves recognition and how each driver’s fuel efficiency compares.
Scores connect with attendance, settlement and rewards in driver management, so good driving can be rewarded in the same system that pays drivers.
- Green, amber and red behaviour ratings for every driver
- Overspeed and harsh braking counts per driver
- Fuel efficiency compared driver by driver
- Score trends to see who is improving
Find out which loads really make money
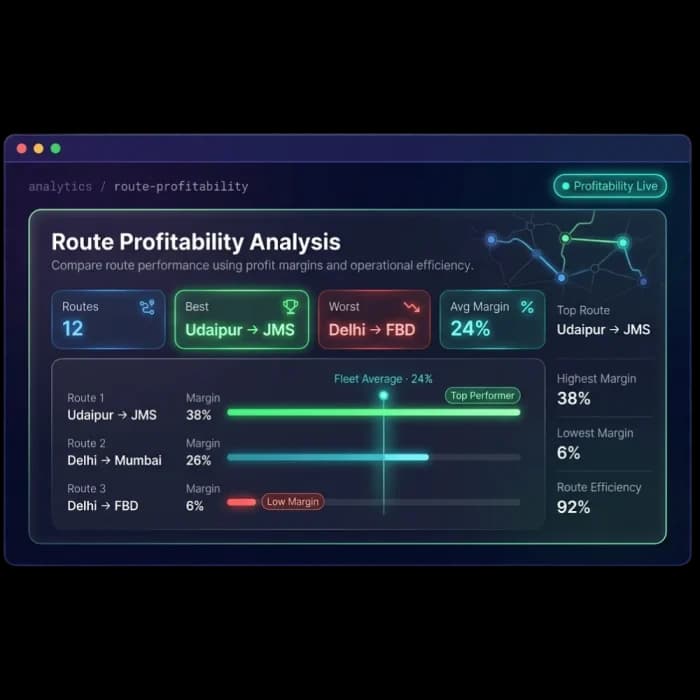
Each trip is costed when it closes: revenue from GPS kilometres and the agreed rate card, minus diesel, driver pay, FASTag tolls and other expenses. Trips then roll up into route and customer views, showing the margin on every lane and every client.
That makes rate discussions much easier. If a customer’s loads always mean long detention and an empty return, the numbers show it, and you can price the next quote accordingly.
- Profit or loss for every closed trip
- Margin by route compared with the fleet average
- Customer profitability and revenue analysis
- Revenue per km across vehicles and lanes
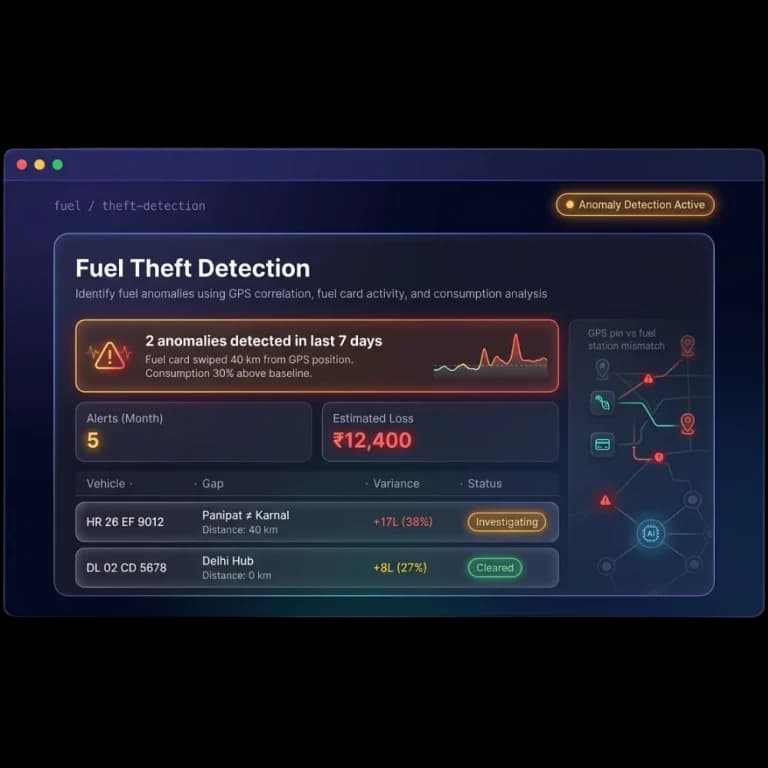
Let the AI point out what looks wrong
Nobody has time to read every report every day. Fleet Scanner™ watches fuel, trips, drivers and costs continuously and flags patterns that break from normal, such as a fuel card used far from the truck’s GPS position, consumption well above baseline, or a route that keeps running late.
You can also ask the Fleet AI Agent questions in plain language, like which trucks are overdue for service or which routes lost money this week, and it answers from live data. It can also forecast demand and breakdown risk.
- Fuel consumption and fuel card anomalies
- Changes in driver performance
- Route delay detection
- Cost and operational trend analysis
Put the right numbers in front of the right people
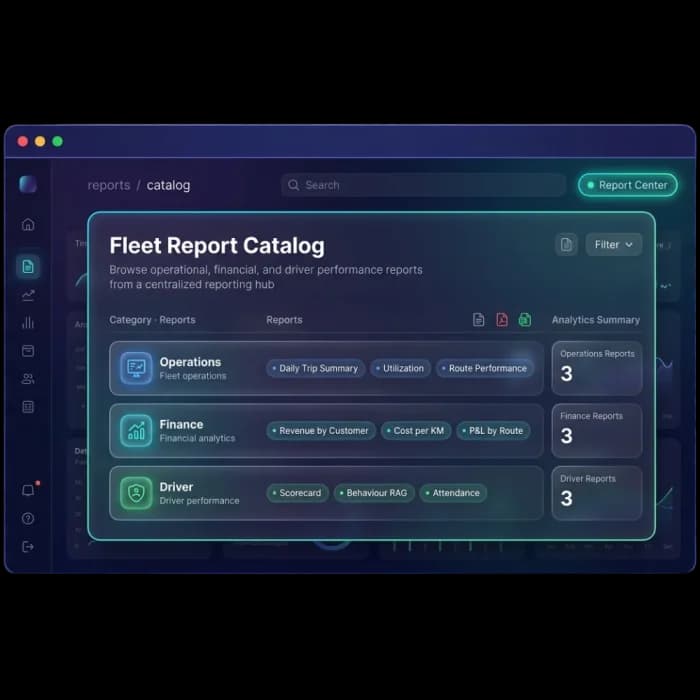
Live dashboards give operations a view of today, while the fleet reports software hub holds 60+ ready reports across vehicles, drivers, trips, fuel, maintenance and finance. Filter by date, vehicle, driver, route or customer in a few clicks.
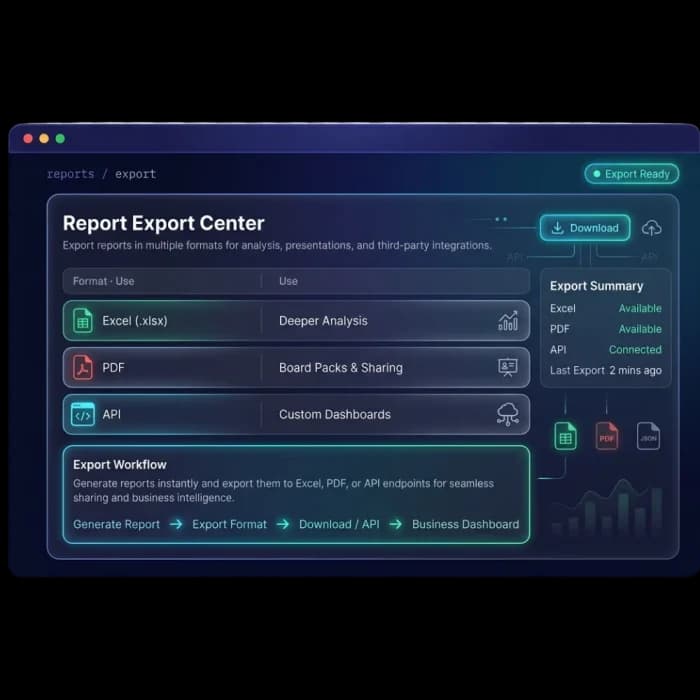
Schedule a daily trip summary for the operations team, a monthly route P&L for accounts and a weekly driver scorecard for the fleet head, then export to Excel or PDF or pull the data through the API. Analytics is part of the wider fleet management software, so nothing has to be re-entered.
- Live dashboards for vehicles, trips and costs
- Reports emailed daily, weekly or monthly
- Excel, PDF and CSV export with one click
- API access for your own BI and accounting tools
Better margins from data you already have
Price Loads With Confidence
Quote freight rates based on your real cost per km on that lane, not on habit or the last rate you remember.
Cut Diesel Waste
Compare km/l across trucks and drivers, find idle-heavy vehicles and catch suspicious fuel drops early.
Grow the Routes That Pay
See which lanes and customers earn a margin and which ones only keep the trucks busy.
Coach Drivers on Facts
Scores built from overspeeding, harsh braking and idling make feedback and rewards fair and easy to explain.
Plan Maintenance Spend
Watch repair and tyre costs per vehicle over time so you know when a truck has become expensive to keep.
One Version of the Numbers
Operations, accounts and owners all look at the same live data instead of arguing over different spreadsheets.
From GPS pings to profit decisions
Collect
GPS, trips, fuel, tolls & repairs flow in.
Calculate
Cost per km, km/l, P&L & scores worked out.
Compare
Trucks, drivers, routes & customers side by side.
Flag
AI points out unusual fuel, delays & costs.
Share
Schedule, export or ask in plain language.
Everything You Need to Know
Simple answers to common questions about fleet analytics in Fleet Scanner.
Get Free DemoWhat is fleet analytics software?
Fleet analytics software turns the data your trucks and teams already produce, such as GPS distance, trips, fuel fills, FASTag tolls, repairs and driver behaviour, into clear numbers you can act on. Fleet Scanner™ works out cost per km, fuel efficiency in km/l, idle time, utilisation, driver scores and the profit or loss of every trip, then shows them on dashboards and in ready reports.
How does Fleet Scanner™ calculate cost per km?
Fleet Scanner™ takes the kilometres each vehicle actually ran from GPS and divides the costs recorded against it, including diesel, tolls, driver pay and trip expenses, maintenance and tyres, across that distance. You can see cost per km for a single truck, compare it with the fleet average, and break it down by route or customer.
Can I see which trips and routes are profitable?
Yes. Each closed trip gets a profit and loss figure: revenue from the GPS kilometres and the agreed rate card, minus fuel, driver cost, tolls and other expenses booked to that trip. Route and customer profitability views then add these trips up so you can see which lanes and clients earn a margin and which do not.
How are fuel efficiency and idle time measured?
Fuel fills and fuel card records are matched with GPS distance to give km/l for every vehicle and driver over any period. Idle time comes from GPS and ignition data, showing how long a truck stood with the engine running. Unusual drops in efficiency or fuel levels are flagged so you can check them quickly.
What does the AI add to fleet analytics?
The Fleet AI Agent watches the same data continuously and points out patterns that need attention, such as fuel consumption anomalies, changes in driver performance and route delays. You can also ask questions in plain language, for example which routes lost money this week, and get an answer built from live fleet data.
Can analytics reports be scheduled and exported?
Yes. Any of the 60+ reports can be filtered by date, vehicle, driver, route or customer, scheduled to arrive by email daily, weekly or monthly, and exported to Excel, PDF or CSV. The same data is available through the API if you want to use it in your own dashboards or accounting tools.