
Driver Scorecards: A Complete Guide for Fleet Managers
Learn how driver scorecards measure safety, fuel efficiency, and driving habits, with scoring formulas, performance bands, and coaching tips for fleet managers.
 Prerit Khera12 min read

A Driver Scorecard is a tool for fleet managers that provides all the information they need to assess their drivers. A driver scorecard is a one-time rating that quantifies the safety and efficiency of a driver's performance over a certain period, based on telematics events like harsh braking, idling, and speeding. Transforms thousands of raw events into one number you can compare between the different drivers to improve the driving of the drivers who need it and encourage the good drivers. This guide describes what's in a score, the scoring process, how to adjust bands and what to do with the score.
What is a driver scorecard?
A driver scorecard is one rating that adds up the driver's overall safety and efficiency during a defined time period, typically 0 to 100. Based on the telematics events that the vehicle already collects, like harsh braking, speeding and idling, it is aggregated and weighted in accordance with their significance, and then condensed into a single number that can be compared between drivers, and tracked over time.
The score is usually created within a driver management module as part of the driver's profile, so the score is not in a separate report, but rather next to the driver's profile.
What goes into a driver score
The majority of scores are composed of Safety Events, Efficiency Events and Policy Checks. Typically, safety events will be given the highest weight. The specific combination is dependent upon the capabilities of the devices: A GPS tracker provides speed and location, and an accelerometer or a video telematics device also records harsh-driving and distraction events.
Input | What it measures | Why it matters |
Speeding | Time or distance over a set limit, or over road-speed data | Strongest single predictor of crash risk and severity |
Harsh braking | Sudden deceleration above a threshold | Signals tailgating or distraction; wears brakes and tyres |
Harsh acceleration | Rapid throttle above a threshold | Burns fuel and signals aggressive driving |
Harsh cornering | High lateral g-force on turns | Risk to load stability and rollover on heavy vehicles |
Idling | Engine running while stationary beyond a limit | Wastes fuel and adds engine hours |
Over-revving | Engine RPM above an efficient band | Fuel waste and engine wear, where RPM data is available |
Seatbelt and phone use | Policy breaches, where detected | Direct safety and legal exposure |
Fatigue indicators | Long continuous driving, night hours | Fatigue is a major cause of serious crashes |
Avoid marking all possible metrics. Four or five events that your fleet cares about are easier to build a score on and easier to act on than 12 events. Select those events that are linked to your highest risk and highest cost – and set aside the rest as reference events.
How scoring works
Most systems begin each driver at 100 points and take away points for each event based on how bad it is. There are four mechanics choices.
Severity weighting. Not all that is going on is the same. A 20 km/h over-speed should be worth a lot more than one harsh-braking event. Set weights so that if someone makes a mistake, the score will come through more than just minor inefficiencies, and if someone has a bad habit, it wouldn't be able to be covered by everything else.
Normalize by exposure. If the 4000 km driver has more events than the 500 km driver, despite the latter being more dangerous per kilometre, it does not mean that the 500 km driver is more dangerous as a driver. Do not score on absolute numbers, but on rate, e.g., events per 100 km or per driving hour. If you don't, your most productive drivers always come off as the worst ones.
Scoring window. Determine the timeframe to measure the score, such as weekly, monthly, or the last 30 days. Short window may react quickly but is loud, long window is stable but slow to see improvements. The average is a rolling 30-day window.
Always leave the formula in sight. Drivers opt to receive a score they can understand, and contest a black box. No matter what weights you use, you can be able to demonstrate a driver how events are penalizing him this period. This is for fairness as well as for accuracy.
A worked example
Look at how it ended up being a score for one driver this week. The driver begins at 100 and loses points for each event, depending on the severity of the event. The following weightings are provided as a guide; you can customise the weightings to make sure that the events in your fleet that you want to stop are given the highest weighting.
Event type | Events this week | Points each | Points lost |
Speeding (over 15 km/h) | 3 | -6 | -18 |
Harsh braking | 5 | -2 | -10 |
Harsh acceleration | 4 | -1 | -4 |
Idling over 10 min | 6 | -1 | -6 |
The points lost add up to 38, so the raw score is 100 − 38 = 62. This driver drove 1200 km, however, and a driver who drives more will naturally have more events to their credit and a raw score will penalise the busier driver. For comparison of driving style, rather than distance, scale the points lost to a fixed reference distance:
This means that the loss of points (L) is subtracted from the 100 and multiplied by the ratio between the reference distance (D) and the actual distance (A) to obtain the Normalized score.
Using a 1,000 km reference distance: 100 − (38 × 1,000 ÷ 1,200) = 100 − 31.7 = 68 (rounded). So these same events have an unnormalized score of 62, and an normalized score of 68 when normalized to a per distance basis. Choose one reference distance and one scoring window to be applied to all drivers to make the numbers comparable. All of the distance, weights and score bands here are examples of starting points, not standards.
Turning scores into bands
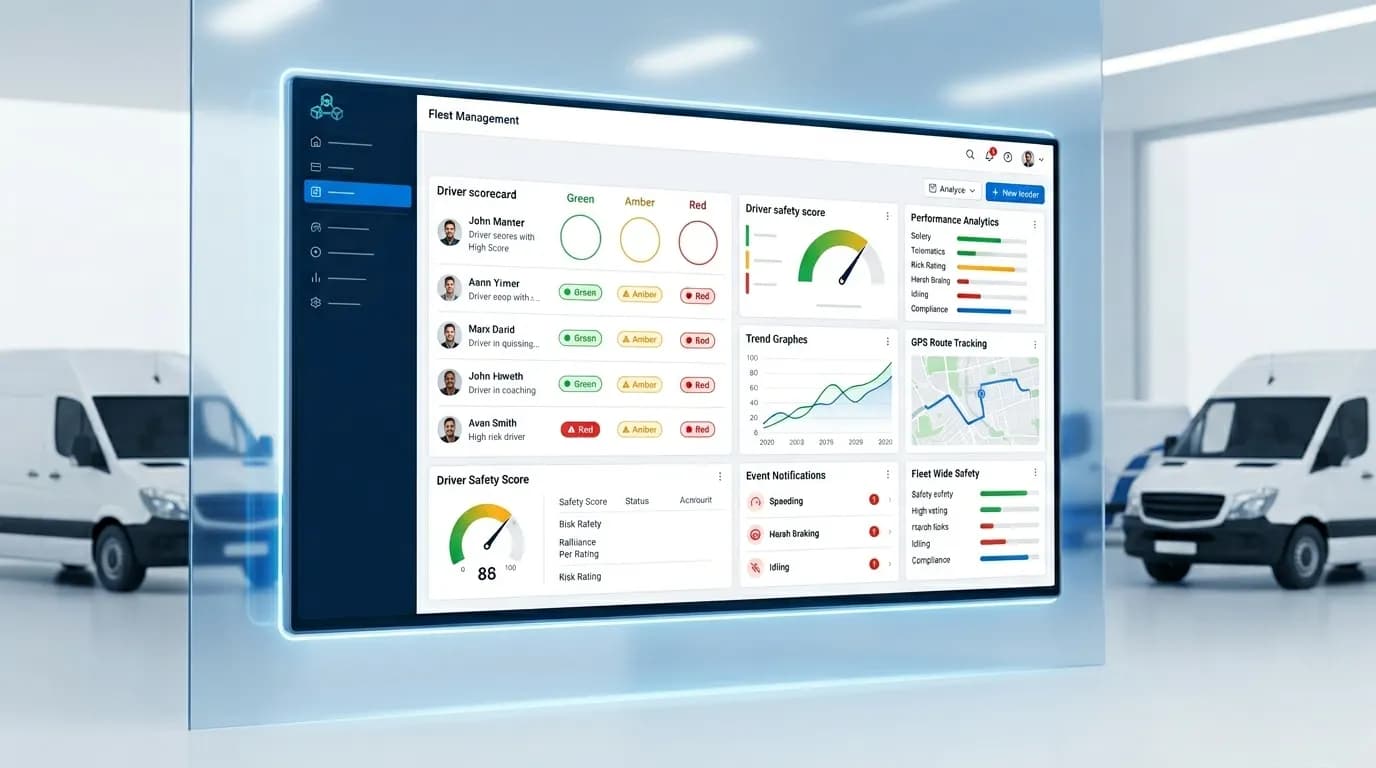
A 82 score is not very significant by itself. Most fleets categorize scores into “red”, “amber” and “green” bands, where any driver who scores in “red” is a driver who needs to be “coached”, “amber” is a driver who needs to be “coached”, and “green” is a driver who needs to be “coached”. The typical split for an 85–100 green, 70–84 amber, and below 70 red may be different depending on the distribution of scores of your fleet, but the cut-off points need to be determined by your fleet's distribution of scores.
Band | Typical range | What it means | Action |
Green | 85 to 100 | Safe, efficient driver | Monitor; recognise good performance |
Amber | 70 to 84 | Some risky habits | Short, specific coaching |
Red | Below 70 | Repeated or serious risk | Intervene this week |
These ranges are a good place to begin, but not a rule. You determine the correct cut-offs based on the distribution of scores in your own fleet, versus another fleet's score distribution.
The setting of those cut-offs: this is a separate challenge: you create a baseline based on history over a few months, rate the severity of the event, add override rules so that a critical event regardless of the average will result in a red, and test the bands against your "worst" and "best" drivers before you have them implemented. The complete method and an example banding table are provided on how to set RAG thresholds for driver scores.
How to act on scores
A scorecard will only be useful if the score is used to take action. The three things that make the numbers a change in behavior are:
Coach the amber drivers. That's where the bulk of the gain is. Green drivers require nothing, red drivers require a formal conversation but amber drivers require short, specific coaching – show them their two worst event types this period and agree one thing to change on their own trips. Coaching with the same number is more effective than general coaching.
Reward the green drivers. A low score that is only known when it is of poor quality turns into a punishment process that drivers do not enjoy. Make all green scores meaningful, like a monthly bonus, first choice of routes, or just simple recognition. One way to do this is to provide a points-based reward system, which can be used in settlements.
Set override rules for critical events. There are events that are large enough to have their own impact without considering the average. If the driver came out of a vehicle while the lap belt wasn't fastened, or if the driver used a mobile phone when driving, the event is a crash level event, not a month level event. Make these choices before you start so that you can proceed with the same answer.
Review on a regular schedule – not just when things go wrong. Keeping the system alive with a quick review of the red and amber lists once a week, and a driver trend once a month.
Building a scorecard drivers trust
The quickest route to ruining a scoring programme is to introduce a score that a score driver does not consider to be just. There are some things that will help prevent that from happening.
Fix data quality first. Phantom events are caused by a loose sensor, or by a tracker that is too far away to register a signal. Driver is flagged by harsh braking even if it was not actually harsh, they lose faith in the entire score. Check devices and thresholds prior to when consequences follow scores.
Compare like with like. One threshold applies to both a long haul highway driver and a last-mile city driver, which is a bad idea, as the conditions are different. Compare and group drivers by route type/class and compare within groups.
Explain it before you launch it. Explain prior to the first score what is being measured, how each band functions, and what will be accomplished at each band. A score that is added to the game as a coaching aid is interpreted differently than a score that is shown in a league table.
Allow a dispute route.Allow drivers to mark an incident that they feel is incorrect. It will be mostly valid, but the little honest mistakes you pick up and the integrity that it conveys, are worth it.
The opposite of these are common mistakes: scoring too many metrics, using raw counts rather than rates, bands with no baseline, and springing the score on drivers with no explanation.
Beyond safety: the combined scorecard
Safety is the typical beginning, but once drivers have confidence in the safety score, then add efficiency and service metrics to create a comprehensive picture of performance. The three layers the majority of fleets will get are:
Safety: the above harsh event, speeding and fatigue score.
Efficiency: fuel economy and idling, best provided byfuel monitoring to ensure that numbers accurately reflect fuel consumption, rather than driving style.
Service: On-time arrivals and completed stops, from your trip operations records.
Do not combine the three into one score. Although a driver be very safe, be slow; or be heavy on fuel, be fast; a single blended number conceals just the trade-off that a manager needs to see. Display the three side by side then weigh them to reflect what your fleet is paid to do: safety first with passenger transport; fuel and service first with logistics.
FAQs
What is a good driver score?
This is subjective, depending on your bands, but on a 0 to 100 scale most fleets consider 85 and higher to be in green, 70 to 84 to be in coaching, and below 70 to be in intervention. A driver's score is not about where it's at on one day, it's about where it's going over time.
How is a driver score calculated?
Most systems begin each driver at 100 points and penalize each event with a corresponding number of points, depending on its gravity and are scored as a rate per 100 km or per hour, rather than as a raw count. These weights depend on the platform and the measurements that your fleet takes.
Do driver scorecards actually reduce accidents?
With scorecards, the reward is the action that is taken – coaching amber drivers, rewarding safe drivers. What nobody reads doesn't change. Crashes tend to decline as fleets combine a scoring system with frequent coaching.
What equipment do I need?
A basic gps tracker provides speeding and location. Most modern trackers will have an accelerometer for when they are being put to the test with harsh braking, acceleration and cornering. Seatbelt, phone-use and fatigue detection require a dashcam or video telematics system.
What is the difference between a driver score and a driver scorecard?
The driver score refers to the one number (e.g., 82/100). There's a fuller picture behind that driver scorecard, and it's the one I'd like to share here: the driver's score, events leading up to that score, the trend over time, and the band that the driver falls into. In everyday use the two terms are often used interchangeably.
How long does it take to improve a driver score?
A lot of drivers will see improvement in a few weeks if they receive specific regular feedback as the habits that cost points (harsh braking and speeding) change very rapidly once a driver can see them. Continued improvement requires that the coaching continue, not just for the score.
Can a driver score lower insurance premiums?
It can, indirectly. A documented scoring/coaching programme, which reduces incidents, will improve your claims history, which insurers price on. Some insurers also have telematics-based programmes that utilize driving information straight away. Do not expect to get lower premiums but treat them as a likely second order benefit.
Learn how driver scorecards can function with your fleet. Book a free Fleet Scanner demo.
Keep reading

What Is Driver Management Software? How Driver Scoring Works
Driver management software manages and scores and enhances a fleet's driving behavior by translating telematics data (speeding, harsh braking, harsh acceleration, idling and more) into a per-driver safety score and coaching plan . If you are asking what is driver management software, this guide answers it.

How Driver Management Software Reduces Fleet Operating Costs
When driver information, routes, compliance logs, maintenance records and trip operations are tied to disparate systems, costs for the fleet go up. This guide shows where fleet operating costs come from and how to bring them down.
How to Set RAG Thresholds for Fleet Driver Scores
Driver RAG thresholds are integral to advanced driver management systems and safety initiatives. They use the raw driver performance data to transform it into straightforward categories to help fleet managers easily pinpoint at-risk behavior, problems with safety, and safe drivers.